
Search and rescue tactics
Choose a top task:
Email us for help.
Browse the A-Z directory.
A
B
C
- Cafeteria
- Campus buildings (NETC)
- Campus fire safety
- Cancer
- Candles
- Carbon monoxide
- Certificates
- Chemicals (home)
- Children
- Christmas trees
- Civil unrest
- Climate change
- Codes
- College credit
- College degrees
- Command and control (training)
- Command and coordination (NIMS)
- Community risk reduction
- Community Wildfire Protection Plan
- Contract instructors
- Cooking fires
- Course Call
- Course catalog
- Course codes
- Course evaluation
- Course vacancies
- Courses (NFA-approved)
- Courses (off-campus)
- Courses (on-campus)
- Courses (online)
- Courses (local-/state-sponsored)
- COVID-19
- Critical infrastructure protection
- Credentialing (NIMS)
- Cybersecurity
E
- E-cigarettes
- Electric vehicles (charging)
- Electrical fires
- Eligibility (student)
- Email subscriptions
- Emergency incident rehabilitation
- Emergency Management and Response — Information Sharing and Analysis Center (EMR‑ISAC)
- Emergency medical services (EMS)
- Emergency response to terrorism (training)
- Employment vacancies
- Engineer and architect scales PDF
- Ergonomics
- Escape planning
- Ethics statement
- Evacuation (wildfire)
- Executive Fire Officer Program
F
- Fall prevention
- Federal travelers
- FEMA ID (hotels/motels)
- Fire-adapted communities
- Fire Administrator
- Fire and Emergency Services Higher Education (FESHE)
- Fire and Life Safety Communicators Initiative
- Fire Department Registry
- Fire extinguishers
- Fire incident report
- Fire investigation
- Fire Is Everyone's Fight®
- Fire Marshal Interchange
- Fire prevention
- Fire protection systems (training)
- Fire safety
- Fire sprinklers
- Firefighting on federal property
- Firefighter fatalities
- Fireworks
- Fitness
- Flu
- Funding
H
I
J
K
L
M
N
- National Fire Academy (NFA)
- NFA Online
- National Civil Defense/Emergency Management Monument
- National Emergency Response Information System (NERIS)
- National Fallen Firefighters Memorial
- National Fire Incident Reporting System (NFIRS)
- NFIRSGrams
- National Incident Management System (NIMS)
- National Master List
- National Preparedness System (NIMS)
- National Qualification System (NIMS)
- National Weekend Program
- National Wildfire Coordinating Group (NWCG) online courses
- NIMS implementation
O
P
- Pandemic
- Photo identification (campus access)
- Photoelectric smoke alarm
- Photos (send us)
- Photos (stock)
- Pictographs
- Planning
- Podcasts
- Portable generators
- Position statements
- Prevention
- Professional development
- Professional development matrix
- Protective clothing and equipment
- Public education (programs)
- Public education (training)
- Public information officer (PIO)
- Publications
R
S
- Safety (firefighter)
- Self-contained breathing apparatus (SCBA)
- Self-study courses
- Sesame Street
- Severe weather
- SID (Student Identification Number)
- Smoke alarms
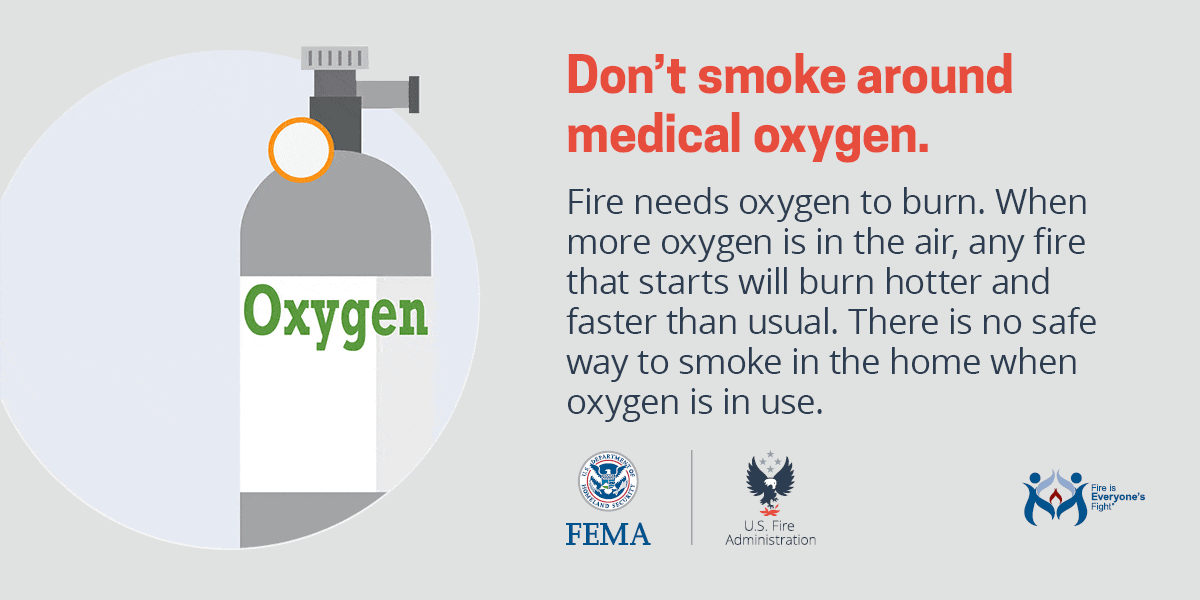
- Smoking fire safety
- Social media
- Staff directory
- State fire profiles
- State and local training courses
- State points of contact
- State Weekend Program
- Station design
- Statistics
- Stipend (travel) reimbursement
- Strategic plan
- Student rules
- Student services
- Suicide
- Summer fire safety
- Superintendent
T
V
W
X
- No listings
Z
- No listings